A big economic announcement this week will be tomorrow's Advance Estimate for Q4 GDP from the Bureau of Economic Analysis. The final number for Q3 GDP was 3.1%. The general consensus is that Q4 will show a significant decline in this broad measure of the economy. Investing.com weighs in at 1.8%. According to Briefing.com, the consensus for Q4 is 1.0%. However, Briefing.com's own estimate, I should point out, is considerably lower at 0.1%.
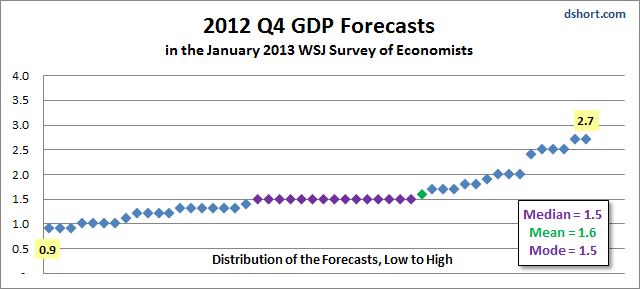
The substantial spread between the Briefing.com consensus and its own estimate prompts a question. What is the distribution of opinions among a broad range economists on this benchmark metric? Is the range wide or narrow? Let's review the data in the Wall Street Journal's January survey of economists, conducted January 4-8, which is available in Excel format here. Fifty of the 52 economists solicited in the survey responded. The chart below arranges their Q4 GDP forecasts horizontally from low-to-high to give us a visualization of the distribution of responses and any outliers.
Clik here to view.

As the chart suggests, the majority of professionals fall into a fairly narrow range around the 1.5% Median (middle), which is also the Mode (most frequent number). The Mean (average) was slightly higher at 1.56% (1.6% at one decimal place). A conspicuous feature of this visualization is the half-dozen outliers in the 2.4% to 2.7% range.
Looking Ahead to Q1
What do the economists see for Q1 of 2013? Not surprisingly, the forecast spread widens as economists look further into the future, ranging from 0.5% to 3.1%. The Mode, at 1.5%, is the same as for Q4 2012; the Median is fractionally higher at 1.6%. The Mean is a bit higher at 1.7% resulting from the increasing optimism at the high end.
Clik here to view.

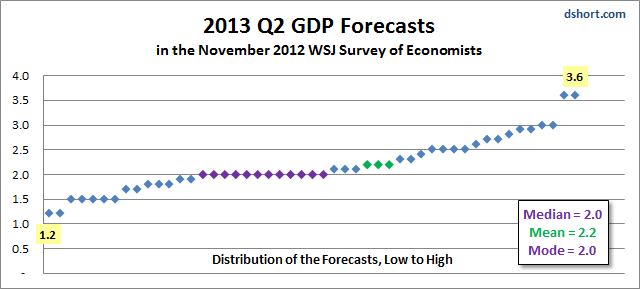
The numbers noticeably improve for Q2 2013, with the Median and Mode both rising to 2.0%, and the Mean rises to 2.2%. Also, we have a pair of optimists who put the Q2 number at 3.6%, which is above the historic average of 3.2% since the inception of quarterly GDP in 1948. Incidentally, the 10-year moving average is only 1.7%.
Clik here to view.

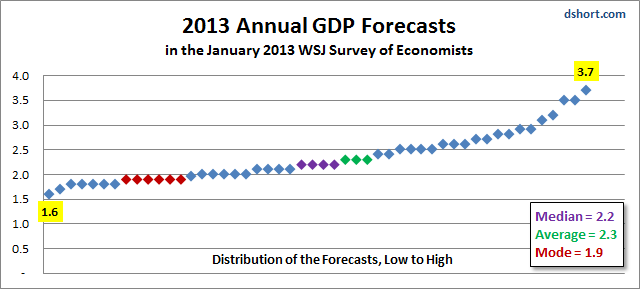
I'll close with the WSJ economists' forecast for the annual 2013 GDP.
Clik here to view.

Here we see the Median rise to 2.2% and the Mean to 2.2%. The Mode (most frequent forecast) curiously slips a bit to 1.9%.
I'm posting this at Tuesday midday. On Wednesday morning we'll be able to determine how close the WSJ consensus on Q4 GDP (first chart above) is to the BEA's Advance Estimate.
Please follow Money Game on Twitter and Facebook.
