In the good ol' days, we would worry about bond yields (and thus bond prices) compared to silly things like the inflation rate, dividend yields, mortgage rates, etc. But it is a brave new world now.
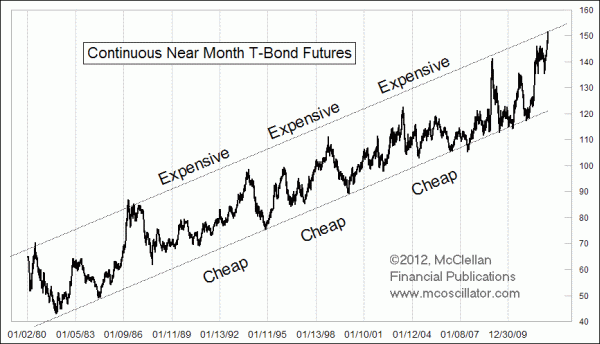
The key driver for valuing Treasury bonds at the moment is the utility they offer as a form of collateral among banks loaning money to each other. So with Europe's debt markets in even greater turmoil now than when Greece's debt got a "haircut" last year, T-Bond prices are zooming up once again to the top of the 3-decade rising trend channel.
Back in January 2012, I wrote about how T-Bond prices were turning down from near the top of that trend channel. We can see now that the pullback from that peak only made it down to about halfway between the channel lines. Now the recent upturn has taken the price of T-Bond futures all the way back to the upper channel line.
Image may be NSFW.
Clik here to view.
History shows that bond prices can hang around at the upper channel line for quite a while, as we saw with the 1986 top. But the more common result is for bond prices to make a spike top, and then to fall back down with a slope that is symmetrical to the slope of the ascent into the spike top.
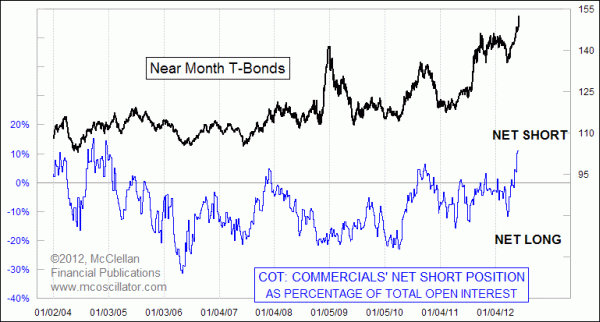
That latter type of outcome seems the more likely one also because of what we see in this chart:
Image may be NSFW.
Clik here to view.
Commercial traders of T-Bond futures have now moved to their biggest net short position since late 2004. They are the big money traders, and presumably the smart money, so when they get to a really lopsided net position like this, it is worth paying attention to. Commitment of Traders (COT) Report data is a topic that I address every Friday in our Daily Edition.
We also know from studying the 60-year cycle in T-Bonds that bond prices are supposed to be declining (yields rising) from now to around 2040. So for bond prices to still be hanging around at the top of the 3-decade rising trend channel means that they are putting off the task of transitioning to the new trend direction. Historically that means bond prices are going to have to work extra hard at some point to make up for lost time.
My guess is that such a point will arrive when the Fed's inflation of the money supply turns into actual consumer price inflation. M2 is up 9.7% from a year ago, and 36% since April 2007. Eventually all of that excess money is going to get to work pushing prices upward, and bond traders are going to realize that locking up a 2.5% yield for 30 years is not such a good deal.
Subscribe to Tom McClellan's free weekly Chart In Focus email.
Related Charts
| Apr 06, 2012 Image may be NSFW. Clik here to view.  Deserved or Not, T-Bonds Are Set Up For A Rally |
Jan 20, 2012 Image may be NSFW. Clik here to view.  Bonds Turning Down From Top of Channel |
Aug 27, 2010 Image may be NSFW. Clik here to view.  60-year Cycle In Interest Rates |
Please follow Money Game on Twitter and Facebook.
